

tl;dr
- most real world anomaly detection problems involve time series
- the discussions about the right algorithm are pointless. Or at least not that important.
- finding a loss function that approximates the business requirements is crucial.
- machine learning (or “AI”) alone will not solve your anomaly detection problems.
- the detection part is just one part of an useful anomaly detection system.
- root-cause analysis and explainability are equal important parts.
- as is continuous human feedback (human in the loop).
- domain driven rules are helpful. Use them wherever you can get them.
- most of the time, domain experts, augmented and supported by intelligent systems and tools, are still the only reliable anomaly detection system.
- learning expected behavior is easier than defining all possible anomalies
- anomaly detection is not forecasting!! Be willing to discard lots of your data to get a clean data set. I won a kaggle competition without really trying because I threw away lots of the data.
Introduction
If somebody accidentally drops the term “anomaly detection” (AD) these days, it is very likely that this poor soul will get bombarded with a lot of well intended data-science folk wisdom, blog posts from big-tech companies, papers by highly touted academic researchers and, obviously, a bunch of python packages that makes everything accessible (in a scikit-leran style “.fit().predict()” API loved by us all). After that, most of the discussions will quickly evolve around algorithms and the packages where these algorithms are implemented in.
With a few exceptions, it is my personal experience that almost all of this is a rather pointless exercise. Or at least not significant.
In this article, I will try to explain why I think so and what we at data cybernetics (DC) intend to change about it. Specifically, I want to talk about more than just algorithms for anomaly detection. I would like to provide a view on what we at data cybernetics think an Anomaly Detection System has to provide, in order to be practically useful! Algorithms are an important part of that. But in many cases, they are even not that important.
Also, of course, I would like to get feedback from readers who, like us, have real world experience with (real time or batch) anomaly detection systems or do academic research in the field. So feedback is more than welcome! Even more so if you disagree with my points and can share different experiences.
The temptation of python packages
There are about a million ways to start your journey in anomaly detection problems. These days, many people probably would start with perplexity.ai or ChatGPT. I would probably prefer the good old Wikipedia entry on anomaly detection. After a short read up, most people get some data and go “hands on”. And on is the hunt for the “best” package.
Depending on the type of AD you are trying to do (more on that later), there are plenty of options:
- PyOD is probably the most recommend option for static outlier detection. Outlier detection is a subproblem of anomaly detection (not every anomaly is an outlier …more on that later).
- good old sklearn can also get some AD work done
- when it comes to AD on time series (which we will focus on), there are tons of options:
- Anomaly Detection Toolkit (ADTK)
- For off-line change point detection, another subproblem of AD on time series, there are ruptures and changepy. Both are using the PELT algorithm.
- banpei offers Singular Spectrum Transform for change point detection.
- A framework for streaming data and online learning anomaly detection is pySAD (here is the respective paper). The package implements many classical algorithms (like Isolation Forrest or the robust-and-hands-on S-ESD), a well as a bunch of unsupervised algorithms that come with quite impressive claims. Like Loda:lightweight on-line detector of anomalies. Or Xstream, an algorithm that, at least in principle, can handle streams of in stationary and noisy data that change in cardinality over time (new time series join the dataset, some leave the dataset). Which is a painful but realistic setup.
- Relative Entropy based approaches, like this one
- There is stumpy, a powerful implementation of the Matrix Profile. The Matrix Profile can be a building block of AD andI consider it a quite valuable tool.
- All the big tech companies have anomaly detection solutions. Sometimes offered as a service, sometimes just research or a blog post on their own system. MSFT offers an interesting approach based on Spectral Residual(SR) and convolutional neural networks to mark points that stand out to human observers (paper), or amazon (AWS), who got 3rd in the Detection and Classification of Acoustic Scenes and Events competition with their approach. I will mention google later again because I think they had the right ideas in principle (but the wrong techniques). There is also greykite by LinkedIn, which provides change point detection capabilities.
- there are a bunch of hands on and fascinating stuff made available by Tsinghua NetMan Lab. Like Donut or DOMI (cnn + variational auto-encoder). They seem to see plenty of things exactly the way we do.
- This is not python. But Oracle provides services that, at least to me, show that they really worked on anomaly detection problems. You can find an interesting talk about their favorite algorithm (MSET) and its history in the nuclear industry here
At this point, I may have lost you already. Either because you are super excited and want to play around with these packages. Or because you are exhausted by the avalanche of links. And (rightly) accuse me of doing exactly what I said is not useful: vomiting a bunch of algorithms in your lap. After all, you already have your LinkedIn feed for that. But I hope I can convince you to read on. In parts, I presented that stuff because it might be helpful. But mostly I did this to show you: I know these things! I used many of them and played around with almost all of them. For days! My goal is to spare you the experiments. Spoiler: none of them will provide a “.fit().detect()” solution that will add any value in industry, science and engineering.
Real world anomaly detection problems (in my experience)
Real world anomaly problems are either:
- trivial (many actually are). That doesn’t mean they are not relevant. Actually, I will make the case they are very important.
- or messy and ill-defined problems on noisy and evolving in stationary data sets.
Problems of the second kind often share the following characteristics:
- almost all of them have a temporal component. So we are talking about time series here.
- many problems concern multivariate time series (or multiple time series, for our purpose the distinction doesn’t matter much). Sometimes with many dimensions. Like hundreds if not thousands of time series of sensor data, financial instruments or health data of kubernetes pods.
- many of these time series might not be equidistant/have different frequencies.
- instationary data: the statistical distribution might change over time.
- evolving data sets. Sensors are removed, new sensors are added. This implies cold start problems.
- probably one of the biggest hurdles: often they are ill-defined.
- there is no exact definition of what an anomaly is. Or what is considered expected behavior.
- most of the time there is no exact loss function. How bad is a missed alarm? How bad is and false positive? How much time is allowed to pass until the detection of an anomaly is considered too late?
- some measurements might be real anomalies in a statistical sense, but are to be expected (or even preplanned) and no reason to worry. They don’t do any harm and can be discarded. It is not an anomaly if a machine stops because of rare, but scheduled maintenance work. Did you laugh at this stupid example because it is obvious? Trust me. These are the real issues.
- connected to the point above: you are confronted with mostly unlabeled or weakly labeled data. You might have an “yeah, we had an outage last August. Or July. Or something. And you might find some things in the log files. You should ask Maria or Simon. And the people from customer support might have some incident tickets”. That’s it. If you get frustrated by these things: don’t become somebody who works on anomaly detection systems!
For practical purposes, there are two kinds of anomalies. In academia there are much more. But I will focus on these two:
- outliers. Values that you have never seen in the past and could be a problem.
- change-points. The statistical properties of the time series changes in an unexpected way. This implies that the state of the underlying system has changed.
Both of the above exist in the single variable/single time series case. Or in the multivariate case. A value might be considered an outlier only given in the context of other time series. A certain vibration measurement might be expected given the rotation-per-minute measurements of a turbine, but might be alarming given lower rpm measurements. The anomalies are often called “contextual anomalies. This is where the complex machine learning stuff is supposed to shine.
I present a couple of simple, but IMHO instructive, numpy examples below.
Assume we have the following scenario:
- we have a system with two components. Component A is measured by sensor_1. Component B is measured by sensor_2.
- The behavior of the component B is actually dependent on the values of component A.
sensor_1 = 100 + np.random.normal(1, 15, n)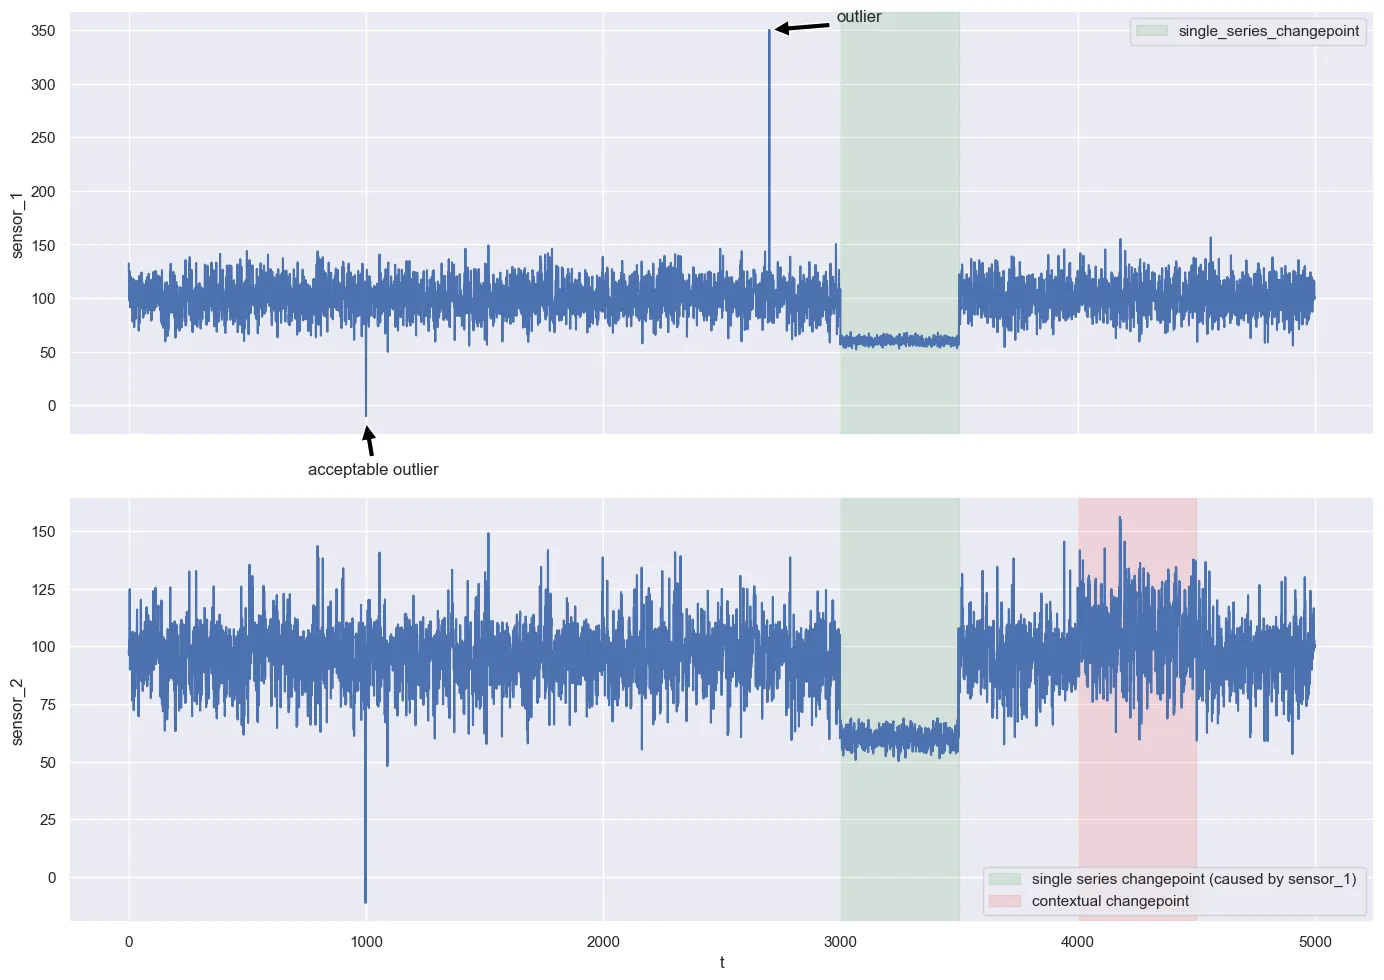
sensor_2 = np.where(np.roll(sensor_1,-2) >= 110, sensor_1, np.roll(sensor_1,-2) + np.random.normal(0, 2, n))- small negative values in sensor_1 occur rarely, but are known to be irrelevant. They should be ignored. This is domain knowledge.
sensor_1[1000] = -10- there is a real outlier of 350 in sensor_1 at t = 1700
sensor_1[1700] = 350- we have a change-point in sensor_1 (marked in green).
changed_sensor_1 = 60 + np.random.normal(0, 3, n)
sensor_1[3000:3500] = changed_sensor_1[3000:3500]- since the measurements in sensor_2 are a function of sensor_1 (or the actual component A measured by sensor_1), the change-point in component A is also directly visible in sensor_2 (also marked in green)
- marked in red is a contextual anomaly in sensor_2. The original dependency between component A and component B changes. This is most likely not visible to the naked eye.
messed_up_sensor_2 = np.where(np.roll(sensor_1,-2) >= 110, np.roll(sensor_1,-2) + np.random.normal(0, 2, n), sensor_1)
sensor_2[4000:4500] = messed_up_sensor_2[4000:4500]
A short summary of the above anomalies:
- a real outlier in sensor_1
- an acceptable “big nothing burger” outlier in sensor_1
- a change-point in sensor_1
- since sensor_2 is a function of sensor_1, this leads to a change-point ins sensor_2 as well
- a contextual anomaly in sensor_2. The dependency between sensor_1 and sensor_2 breaks down.
This simple example already shares plenty of properties with real world problems. Each of these anomalies, ex-post and on its own, is easy to detect. You can ignore the negative values. The single outlier is also obvious. The change-points in sensor_1 as well as sensor_2 can be detected with a single line of numpy or matlab code. Only the contextual anomaly might be a problem. But can also be done. Overall easy.
But if you drop these two time series into one of the tutorials of the “ready to go” python or R packages, it is very unlikely that you detect all of them. Even if I tell you that you can use both time series from observation 0 to 1500 and that you should ignore the negative values. Which is a lot of information. It is very rare that you get a solid block of data from which is guaranteed to be anomaly free so that you can learn what the expected behavior of the system. Might happen. But very unlikely.
I challenge you to do it with your go-to algorithm. It is certainly possible. After all, these are borderline trivial anomalies. But it is a nice exercise anyway.
In real life, you probably have none of the information above. “Yeah, but that’s not a data-science problem then!”. Exactly right, that is basically one of the most important points of this article.
And even if you manage to detect these anomalies in a “timely manner” (whatever that means needs to be discussed), this would, IMHO, still not be enough to add value as an anomaly detection system. You have a good algorithm. That is a necessary condition for an functioning anomaly detection system. But not a sufficient one.
Ok, I get it. It’s hard. But what to do about it?
If we at DC could give you a piece of software and some wise words that would help you to create a reliable and useful AD system, we would be rich and probably be a publicly traded company. We aren’t. So obviously, we do not have a silver bullet.
But we think:
- there are some principles to organize the process of creating an AD system.
- there are properties and features that a useful AD system should try to cover. I will try to explain all of them with our stylized example above.
The process of defining the requirements of an AD system.
In my experience, the process of designing a good AD system contains several steps. You may not be able to cover all these steps in order and to perfection. Mostly for reasons you can’t do anything about. But, like test coverage in software development, I think it is always good to try your best.
- The loss function.
- Understanding the system and the data
- Design the AD system
The loss function
Many would probably start with item 2. But I think it is important to start with the loss function. Defining a good loss function for an AD system is hard. Or even impossible. It involves talking to people who have domain knowledge about the business- or engineering parts of the system that is to be supervised. They might be great engineers or domain experts, but, it is very likely, that their requirements are quite fuzzy. Requirements are always fuzzy in software engineering projects. But AD systems (and other systems with non deterministic outcomes) are especially hard. It is probably your job to get this as concrete as possible. Most likely, you will have to come up with a loss function by yourself. And then sell it to your clients as a good solution.
Also, you need to be reasonable here. People will get frustrated by these discussions really fast, and they will consider it a fruitless and theoretical exercise. It isn’t. Every discussion about it will A) force them to think about it now and specify things, and B) it will inform you about the system. But still. You need to sense when your discussions with stakeholders and domain experts become fruitless.
Second, you need to accept the fact that the loss function is a moving target and will evolve.
Loss function continued: just use the F-Score? Right?
So now let’s get the obvious thing out of the way. You have read numerous academic papers about AD, and they all use the F-score(or some of its weighted variants).
The F-Score is pretty useless for AD problems on time series. For several reasons. One obvious one is that timing does not play any role in the score. If you look at the change-point regions (marked in red and green) of our simple example and suppose you have an anomaly detection system that would perfectly detect the first 50% of the change-point region as an anomaly, it would have the same F-score as my system, that detects the later 50% points of the anomaly.
Another problem is, the F-Score inflates the performance of your system. The classical ML person will label every data point within the red or green areas as an anomaly. So 100s of anomaly points. Most likely, for your domain experts, the whole green area and the whole red area are each just one incident. So we have 3 anomalies in the graph. The change-point regions and the single outlier.Eamonn Keogh, professor at University of California, Riverside and author of several interesting Matrix Profile-based approaches to AD on time series, like this or that one, is an outspoken critique of much (if not most) published research on anomaly detection on time series and has several takes on the problems of the F-score and other accuracy-precision-recall type metrics as a metric for scoring anomaly detection system on time series(here)
There are ways around that. A very practical loss function for AD in time series context is the numenta anomaly score from the team around the numenta anomaly detection benchmark. In general, I highly recommend their work.
So we have a great loss function? Yes and no. I used the numenta score to evaluate systems, but it is often irrelevant to the client. Or has to be parameterized to really represent the insights you gained from annoying the hell out of your poor domain experts.
IMHO, the most effective way is to:
- define a set of simple KPIs with your stakeholders, that are well understood by them and represent their requirements.
- you need a set of KPIs because there is no single KPI that represents all desired properties of an AD system.
- these KPIs may include things like a “maximum number of false positives per week” or “minimum time until alert”.
- it is always great if you can get a monetary value on some of these KPIs (like lost units, costs for sending a technician in the field for a false alert, etc.)
- the KPIs are a great way to showcase trade-offs. “We want to have a system that instantly detects all anomalies and never has a false positive” is not a realistic requirement. Force your stakeholders to make choices: “if you had to pick a poison, what is worse?”
- if possible, try to get the KPIs ordered by priorities. “Must haves” and “nice to haves” are good starting points.
- from that, create synthetic scores and experiment with the numenta score parameters until they are at least roughly aligned with the KPI set.
The above process is not exact. But it is an approximation.
Understanding the system (and the data)
Well. This is not at all helpful. I know. Understanding the domain and the data is crucial. Everybody knows that. At least you would think so.
As already mentioned, you will probably alternate between the loss function item and this one.
By using exploratory data analysis and by talking to domain experts, you will try to answer questions like:
- where is the data coming from, and what does it really represent?
- how is the data measured and stored? Is it immutable? Is some data discarded or overwritten?
- are there domain reasons to look for dependencies between different components (and hence contextual anomalies)?
- do we have labels? And can we trust them (most likely: no. See Wu and Keogh on badly labeled data in benchmark datasets)?
- are there any known anomaly types?
- and much more, that might be specific to your use case.
You will have to document your gained knowledge as well as your assumptions (things neither you nor domain experts could confirm). For our simple toy example, this would probably look something like this:
- our whole system has only two components. A and B.
- both components have one sensor.
- the data is an immutable “append only log”.
- the data is not generated by an event triggered process but from regular sensor readouts. So the data is equidistant.
- both sensors have the same measurement frequency.
- component A is an input for component B. The connection is feed-forward. So there is no closed feedback loop between A and B.
- sensor errors with negative values are common and can safely be discarded.
- component A should never be measured about 300. Assume this is physically impossible.
- we don’t have labels for the whole data set, but the domain experts are quite sure that the system and sensors were working as expected from data point 0 to 2500.
This is all valuable information. Knowing that the data is immutable and never altered is extremely comforting. The author of these lines once looked extremely stupid because he didn’t think about that the data stored in the PostGresDB is altered in a nightly batch job and not an faithful representation of what was later provided in real time via a kafka topic.
Also, that equidistant-same-frequency thing saves us a lot of work here. Somehow, many academic papers just assume this, even though it isn’t that uncommon to work with event triggered data in the real world.
Probably the most important part is the assumption that you may have a clean and anomaly-free section of the data set. Even though it’s not always possible, this what always the thing I try to get. As mentioned in the TL;DR section, I am willing to discard most of the data for a smaller but well labeled set. Defining normal behavior is often easier than defining all possible anomalies! So if this is possible, even if it implies a lot of work. In my experience, it is almost impossible to get to an reliable and useful AD system working without that. In our use cases, this data set did not have to be large. But it needed to be clean. Known anomalies are still very helpful, though. For reasons, I will explain later.
Properties of a useful AD system
Before we talk about algorithms, let’s talk about what, in our experience, an AD system should provide to add value. Some of these things might sound like “nice to haves” and are treated that way by many researchers and ML people. But in our experience, these features are rather essential. I can’t put a number on it, but I guess they are that I would sacrifice quite some accuracy for them. These features are not “helpful”. They are the difference between a system that will be accepted and used, and not something that rots in a git and throws alerts that everybody ignores. And honestly, even as the author of the system…you would too.
- decent accuracy. That’s obvious. But what “decent” means, will depend on your use case.
- provide a confidence estimate or probability about the alert. This number does not have to be communicated to the end user. But IMHO it is important when designing the system. Like “non-negotiable” important. Alerting somebody or triggering some other response in a noisy environment is a decision-making problem. And in a noisy environment, decisions should be based on probabilities.
- explainable. This is such a cliché. But crucial. Domain people will discard your system as soon as it made it first or second mistake. They have enough work on their plate. Unless your system never gives a false positive or misses an incident: you need to be able to explain rather rapidly why the system through an alert. People are very forgiving if the system does not seem to be arbitrary to them.
- root cause analysis and help with diagnostics. This is connected to 3), but it is not the same. Remember the information we gathered about our toy example? What would you make out of the first large outlier? Since it larger than 300 and system B is a function of A, and we do not see any effect in B), this is probably a sensor error.
- Finally: human in the loop! This is connected to point 3 and 4. But allow the user to annotate your data set. Give them a GUI for that. Creating a ticket about a missed incident should be one mouse click away. In my experience, the best AD system are the domain experts who are supported and enhanced by your system. A Cyborg. Regarding front end presentation and engineering, we also took away some lessons from the anomaly detection work published by Uber, like uVitals or Risk Entity. Obviously, a dictionary of known anomalies will be helpful here as well.
Algorithms
We did manage to write lots of stuff without mentioning Variational Auto Encoders once. I do believe that there are many good ways to detect anomalies. Like in other ML applications, or literally anything involving uncertainty, combining different approaches will outperform a single approach.
But given the constraints we set on ourselves, we often use the following approach:
- we will use simple rules and thresholds wherever possible! This includes hard-coded rules to detect known anomalies.
- for everything else, we use an ML model to predict the past!
- we use conformal prediction to get some handle on the uncertainty (see the awesome git from Valeriy Manokhin on conformal prediction)
- We then use a CUSUM control charts of the imputation error or comparable things (moving average to the error) to flag anomalies. At present, we often use a conformal prediction inspired approach and calibrate that error metric on a calibration set. Like getting the 99% percentile of the CUSUM or moving average of the error. This is a bit hand-wavy. Since a CUSUM on a random variable is just a function of a random variable, we will try to switch to e-values (or better an e-process) in the future to become more rigorous here. This is even more important if you try to combine several anomaly scores.
Item 1 is a bit controversial. After all, many cite the overflow of their manual rules as their reason to switch to an ML-based approach. I think that is the wrong conclusion. If the system is large and complex, yes, your rule set and thresholds will also become cumbersome as well. But that does not mean that the simple rules are not worth the effort of saving them. In my experience, after the magical Variational Auto-Encoder reveals itself as not being some super weapon, these rules and thresholds come back again. There is no way around it. Invest time in tooling to manage and document these rules. But a message that reads: “anomaly alert in component A. Reason: measurement above 300 at t=2700 (link to documentation of rules)” is probably the most useful thing you will ever get out of an AD system.
Predicting the past is a simple approach that is useful if you have some time to decide if you have an anomaly. This is mostly what google did in their “predicting the past” paper. If you read the paper, you will see that they agree with some of our design requirements of an AD system. They just use different tools.
Obviously, this does not work if you have to decide immediately at the arrival of each new data point. But in my experience, these use cases are rather rare. You can train a single model for each time series. Or a model that jointly predicts (or impute or interpolate) the state of the system given some past and some future points of the system. This is quite similar to an auto encoder. But for me, it is easier to formulate it as an prediction problem. This also makes the application of conformal prediction natural. Most of the time, we use a cat boost regressor as a model and train it on the (hardly fought for) anomaly-free data set that represents expected behavior, the system. The model predicts the whole state vector of the system. This manages to catch most temporal and other dependencies. The model represents the normal behavior. And if this model starts to accumulate errors, we flag an anomaly.
Like already mentioned: the thresholds are defined on prediction errors on a calibration set.
The reason for using and imputation instead of a forecasting system is that some time series might be hard or even impossible to predict, but that is absolutely ok. We are interested in the joint behavior of the system.
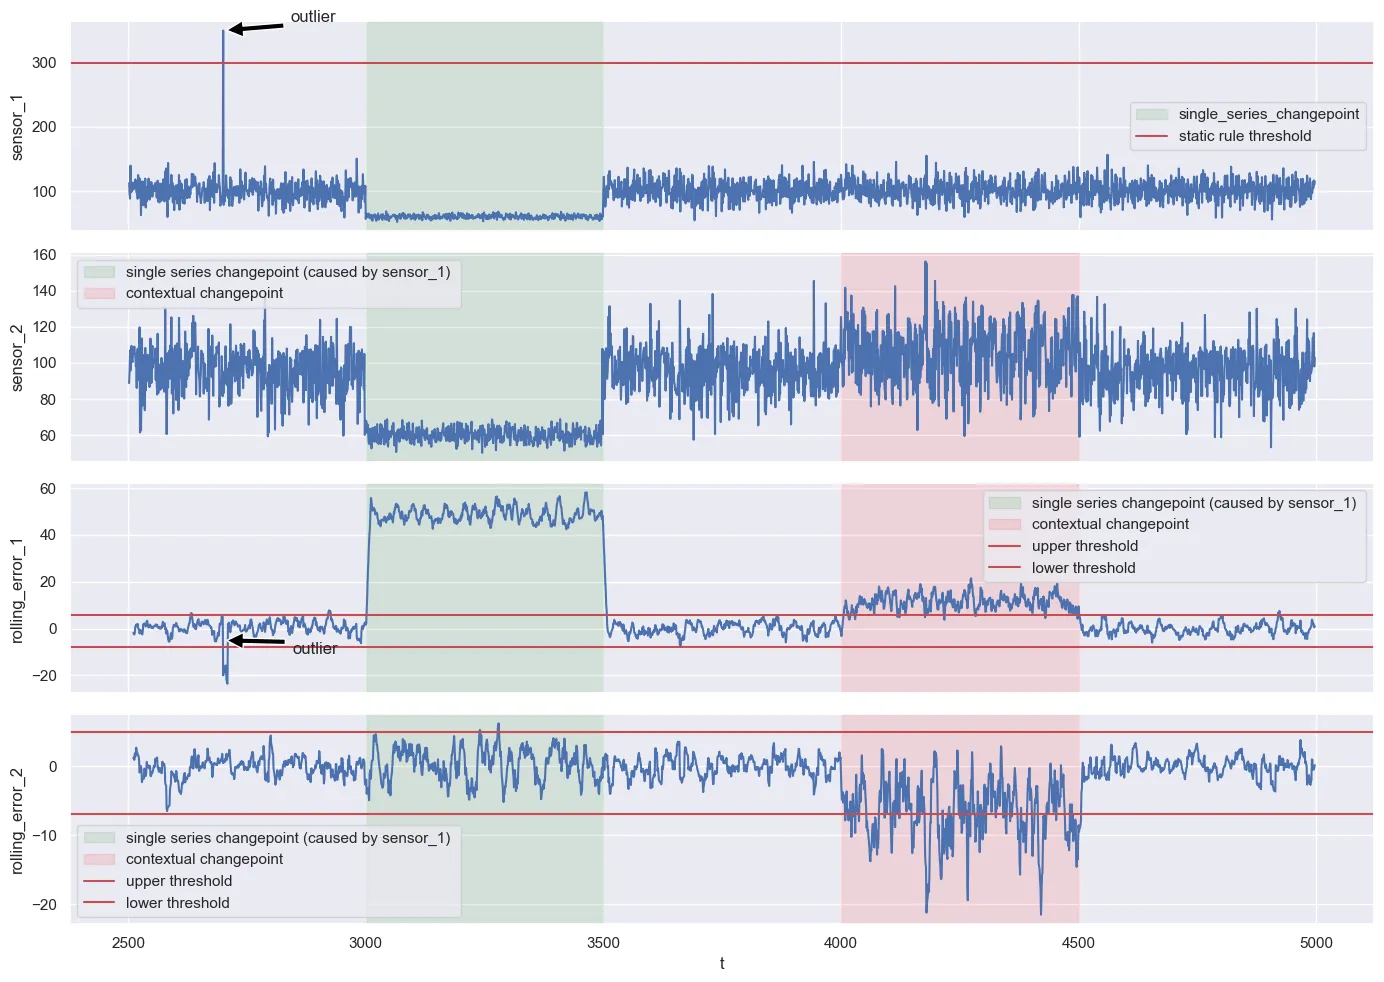
Just to show how useful this can be, we do something here that we should not do in practice. In our example, we know that component B is a function of component A. That should be explicitly modeled. But for the sake of this discussion, assume we don’t know that or there are too many dependencies to model them explicitly. So we train a model, that jointly imputes sensor_1 and sensor_2.
If you plot the moving average of the error and compare it with what you have seen on the calibration set, all three anomalies are detected (even though the first outlier would be perfectly detected by the static “more than 300 is physically impossible” rule anyway). We don’t have a real probability in the classical sense, but can at least say that we have are breaching a historical 99% percentile barrier. That is a starting point to get there.
You will find many was to get to this result. Even though, the contextual anomaly is sometimes harder to get with approaches that are not based on predictions. After all, the anomalies are rather trivial. But as I mentioned above, this is only the starting point of getting a good AD system.
I also have to mention this: there are some AD problems, where the data looks quite noisy, but actually isn’t. That is different from our toy example because there really exist patterns. In these situations, Matrix Profile based approaches are really great to pick up even rather subtle anomalies. Like MADRID, DAMP and Merlin.
Code below. We use 2 values from the past and two values from the future to jointly interpolate sensor_1 and sensor_2. If you ask yourself: why is the Cat boost regressor not hyperparameter-optimized? Because it does not have to! We are not forecasting. Understanding our error on the calibration set is more important than the absolute magnitude of prediction error, as long as the prediction error is relatively unbiased.
from catboost import CatBoostRegressor
from sklearn.svm import SVR
train = df.iloc[0:1900]
calibrate = df.iloc[1901:2500]
test = df.iloc[2500:]

def prepare_data(data):
    data = pl.from_pandas(data)
    features_and_targets = pl.concat([
    data.select(
    [pl.col("sensor_1").shift(lag).alias("s1_lag_" + str(lag)) for lag in range(1,3)] +
    [pl.col("sensor_1").shift(-lag).alias("s1_future_lag_" + str(lag)) for lag in range(1,3)] +
    [pl.col("sensor_2").shift(lag).alias("s2_lag_" + str(lag)) for lag in range(1,3)] +
    [pl.col("sensor_2").shift(-lag).alias("s2_future_lag_" + str(lag)) for lag in range(1,3)]),
    data.select("sensor_1","sensor_2","t")
    ],how = "horizontal").drop_nulls()
    return features_and_targets

cat = CatBoostRegressor(loss_function="MultiRMSE", iterations= 2500, depth=4, l2_leaf_reg=6)
features= list(filter(lambda col: "lag" in col, features_and_targets.columns))
targets = ["sensor_1","sensor_2"]

train = prepare_data(train)
cat.fit(train.select(features).to_numpy(),train.select(targets).to_numpy())

cal = prepare_data(calibrate)
pred_calibration = cat.predict(cal.select(features).to_numpy())
res_cal = pl.DataFrame({
    "pred_sensor_1" : pred_calibration[:,0],
    "pred_sensor_2" : pred_calibration[:,1],
    "sensor_1" : cal.select(pl.col("sensor_1")),
    "sensor_2" : cal.select(pl.col("sensor_2")),
    "t":  cal.select(pl.col("t"))
}).with_columns([
    (pl.col("pred_sensor_1") - pl.col("sensor_1")).abs().alias("abs_error_1"),
    (pl.col("pred_sensor_1") - pl.col("sensor_1")).rolling_mean(20).alias("rolling_error_1"),
    (pl.col("pred_sensor_1") - pl.col("sensor_1")).alias("error_1"),
    (pl.col("pred_sensor_1") - pl.col("sensor_1")).abs().percentile(0.995).alias("p995"),

    (100 - pl.col("sensor_1")).abs().alias("abs_error_1_bench"),
    (pl.col("pred_sensor_2") - pl.col("sensor_2")).alias("error_2"),
    (pl.col("pred_sensor_2") - pl.col("sensor_2")).abs().alias("abs_error_2"),
    (pl.col("pred_sensor_2") - pl.col("sensor_2")).rolling_mean(20).alias("rolling_error_2"),
    (112 - pl.col("sensor_2")).abs().alias("abs_error_2_bench")])
test = prepare_data(test)
pred_test = cat.predict(test.select(features).to_numpy())
Here is a display of the predictions on the test set, the error measure and the respective thresholds from the calibration set. Looks fine and came out of it without too much of a hassle.
Explainability and root cause analysis
So far, we do not have done anything on the explainable and root cause analysis side of the house.
With respect to explainability, I warn against Shapely Values that are thrown around a lot. Mostly because of the SHAP package. People I respect claim that they might be helpful for feature selection. I can believe that (even though they never did much for me in that regard). But I have serious doubts about their value regarding making things explainable. And there is some research questioning that as well (here and here).
Which works surprisingly well (and I can’t explain why nor can I claim that this is always true), is to look for the component where the error exceeds the thresholds the most. Or train single modeled for each time series.
Truth be told, none of that stuff is really helpful or reliable. In our experience, the most effective way is to model root cause analysis separately. With a set of heuristic rules and handcrafted reasoning that is heavily influenced by domain knowledge and classical tools from causal inference. For a cutting-edge solution, I would consider this an application of probabilistic programming in combination with the E-Processes I already mentioned. But to be honest, in my applications we never got that far and this is a topic I am researching myself. Most research on causal inference for time series is quite opaque (always interested if you have interesting sources here) or comes from the world of econometrics (things like Granger Causality). Even though I am trained in econometrics, I was never able to use that stuff properly in an time series-anomaly detection setup.
So here comes the good message for the consultant: compared to the algorithmic stuff, I think it is the explainability, root cause analysis and human-in-the-loop components where you have to do the most work. And also add the most value. So far, I haven’t seen any shortcuts here, and I think solutions need to be domain-specific. So I think there is room for specific tools for pharma research, network traffic, kubernetes clusters, energy systems, financial data or aerospace applications where you can create something that does many things out of the box for that specific domain. But a general “AI” tool? I just don’t see it yet.
Conclusion
Even though your LinkedIn feed and the flood of papers tries to convince you otherwise, anomaly detection for time series is not a solved problem. And even if the detection part would be perfect, it is our opinion that you still need to go a long way to build something that adds value!