· Philipp Leser
Kaggle Competition
Anomaly Detection for the Transition Grid, or "how to win a Kaggle competition without even (really) trying"


For me, the European electricity transition grid is a technical marvel. If you think twice about it, it is quite amazing that this it actually works as flawless as it does.
TransnetBW GmbH invited us to a small get-together at their facility in Wendlingen with all the other competitors of the “AI Service Grid Stability Challenge” .
Several teams presented their problems and potential use cases for machine learning. They have a pleasant “can do” attitude combined with a hands-on and down to earth mentality when it comes to the rising challenges and opportunities. That is kind of comforting to know, given the fact, that scenarios for a black-out are quite horrific ( here a report with scenarios for Germany )
we would like to thank Alexander Werling, Dr. Matthias Ulrich Bohner, Andreas Semmig, Michael Salzinger, Simon Remppis and Dr.-Ing. Dominik Schlipf for the interesting presentations, organization of the event and the opportunity to have a nice chat. Also, we would like to thank Fraunhofer IEE and hessian.AI . Without the, the competition would not have happened in the first place.
The Kaggle Competition
AI Serving Grid Stability wanted to explore the application of machine learning (or “AI”) for the detection of anomalies in the energy industry. Together with the research of the Fraunhofer and a team from TransnetBW they prepared a real world dataset and made it available for the competition.
For us, Data Cybernetics, that dataset was particularly interesting and probably the real reason why we entered the competition in the first place. The dataset is an extract from the PICASSO system. ( Here is the documentation from entso-e ).
PICASSO is one of the unsung success stories of European cooperation in the energy industry. It is one of many integrations of the different European ancillary services markets. In particular, it is about the procurement and exchange of aFFR (automated Frequency Restoration Reserve or secondary reserve) services. There is a quite accessible documentation here .
Simply put: all 4 seconds, the whole grid of all participating nations get optimized. In the first step, it tries to net the imbalances of the control zones by moving electricity, given the transmission constraints. After that, the system tries to optimize the overall costs of the procurement of ancillary services (with respect to the still remaining transmission capacities). The process attempts to maximize the global economic welfare of all participating members. It eludes me, why this great solution is not more advertised
For us, the competition was interesting for the following reasons:
- we do a lot of work in the energy industry
- we do have a lot of experience in ancillary services and related topics (aFRR, mFRR, FCR, BESS optimization…)
- we also have a lot of experience in real-time anomaly detection on systems of multi-variate time series.
We do know ancillary services, mostly from the perspective of people who sell these services. The point of view of a TSO (Transmission System Operator) is quite important to really understand the Ancillary Service market and systems. So we had many reasons to participate.
The dataset consists of 13 time series from different components of the PICASSO system. The data was available for half a year and two control zones.
Like all Kaggle competitions, the dataset is split into a “train” and “test” set. The train set can be used to train and validate models. These models then make predictions on the test set that you can upload to the platform. After the end of the competition, the competition host will evaluate and score your predictions and will publish the final ranking. This final ranking is published on the so-called private leaderboard . Most of the time, there is also a public leaderboard . This can be used to publish predictions before the end of the competition. The predictions will be evaluated on a small subset of the whole test set (like in this case, 30%). You have to be very careful to not over-fit on this information, and you have to check if you can reproduce the improvements on your own train-test split, that you generate from splitting the train set again. The final result is therefore the private leaderboard.
In general, the dataset had everything that we are used to from our anomaly detection projects in the industry. The train set was unlabeled. Nobody told you what an actual anomaly is. That is your job to figure out.
At the beginning we were highly motivated. From the start we didn’t want to win the competition, but build a system, that could actually be used by TransnetBW to monitor PICASSO. Our thoughts and experiences on what an anomaly detection systems needs to look like, in order to be of any practical value, can be found here .
Since PICASSO is an optimal control system. These systems might be exposed to random shocks in the inputs and its channels might be noisy, the optimal control system itself is deterministic.
Our goal was to:
- aquire as much domain knowledge as possible and use this to define deterministic rules, heuristics and thresholds.
- create a digital twin of the optimal control system.
- use that digital twin to predict the behavior of the system
- enhance this by a machine learning model
- use a conformal prediction inspired approach to get a model for the error behavior of these predictions on a cleaned calibration set.
We wanted to provide a system that detects anomalies, but also supports in decision-making and root-cause analysis.
Unfortunately, in became clear pretty fast that we are missing data for that. Most important: the grid frequency of the control area. Also, after a deeper exploratory data analysis, it became clear: there is not much you could do. And by “you”, I mean anybody.
Since we have plenty of other things on our plate, we decided to run one of our default approaches and be done with it.
Winning Solution
If you look at both leaderboards, it is quite obvious that it was dangerous to read too much into the public leaderboard scores. If you run some simulations on a generated data set with anomalies (which are, by construction, rare), and sample 30% from it, you must come to the conclusion: the public leaderboard score carries almost no information. The drastic shuffling in ranking from the public to the private leaderboard is a result of that. In a scenario like that, luck is an important component. Fooled by Randomness (from Nassim Taleb) is a good book and its main message also holds true for a Kaggle competition.
So we won the competition because:
- we didn’t fool ourselves with private leaderboard and ignored it completely. For that reason, we didn’t lose any ground on the private leaderboard.
- we used a very robust approach
- the competition was small, we didn’t need to beat too many teams.
- and of course: luck!
Still- It was nice to see, that one of our basic approaches worked quite well again
That approach is quite simple:
- we use exploratory data analysis and domain knowledge to aggressively clean the train set. We deleted the whole day as soon as we found something fishy. We threw away almost 30% of the data!!
- we wanted to build a system, that predicts the normal behavior of the PICASSO!
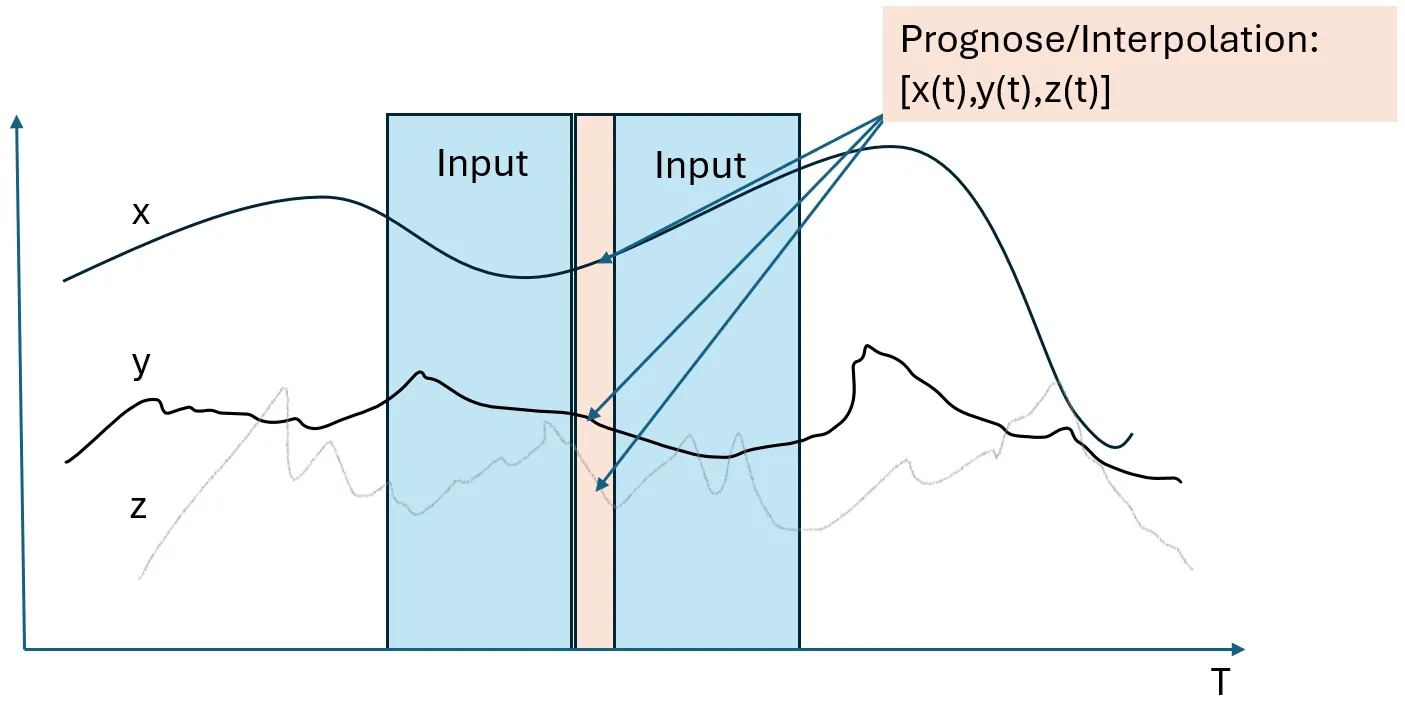
- we used data from 12 time steps in the pas and 12 time steps in the future to jointly predict (or impute or interpolate) the present data.
- if this system accumulates error, we have an anomaly. We used a part of the cleaned train set as a calibration set to calibrate the 95% percentile of a moving average of the error.
This imputation approach predicts the state of all time series at once. This allows to detect temporal as well contextual anomalies. Since we are using data from the future, the prediction error is quite small. The drawback is you have to wait a bit until you can make the prediction. In our case, 12 x 4 = 48 seconds. Most of the time, this is not really a problem. TransnetBW was interested in detecting anomalies after a couple of minutes.

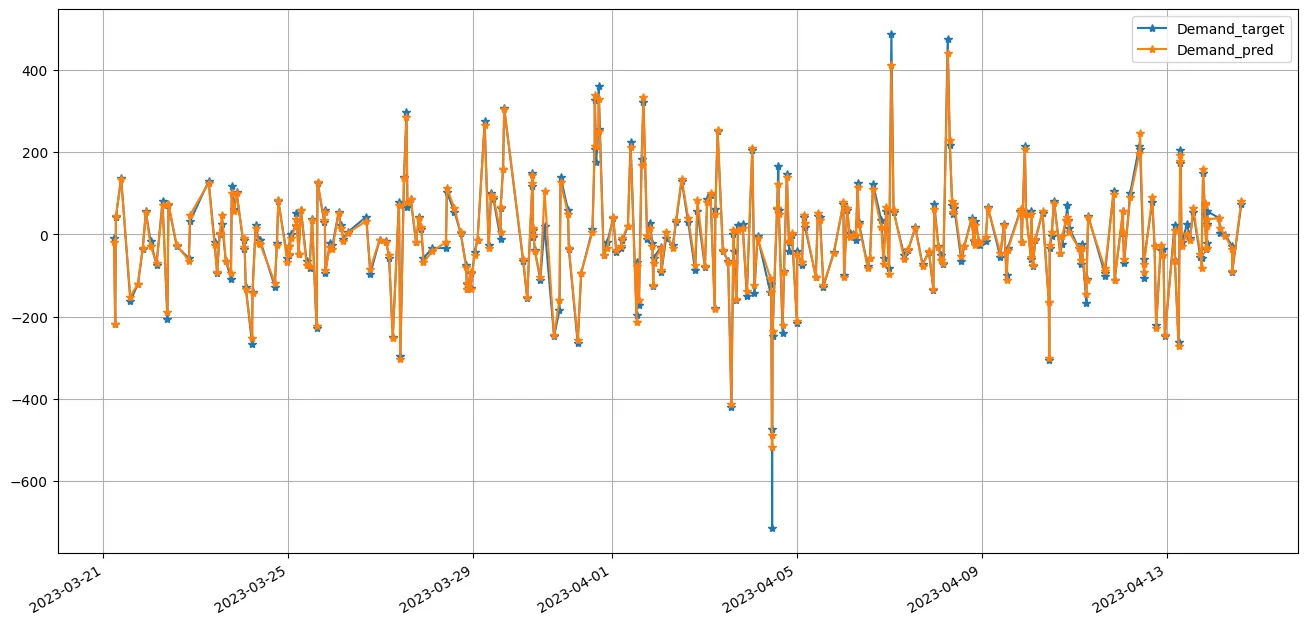
We used Catboost. But IMHO this doesn’t matter much. We don’t have a forecasting problem here. We need to learn the dependencies between the time series, and not predict random shift in demand for aFRR (which are perfectly normal). Without any hyperparameter optimization, the predictions are quite good:

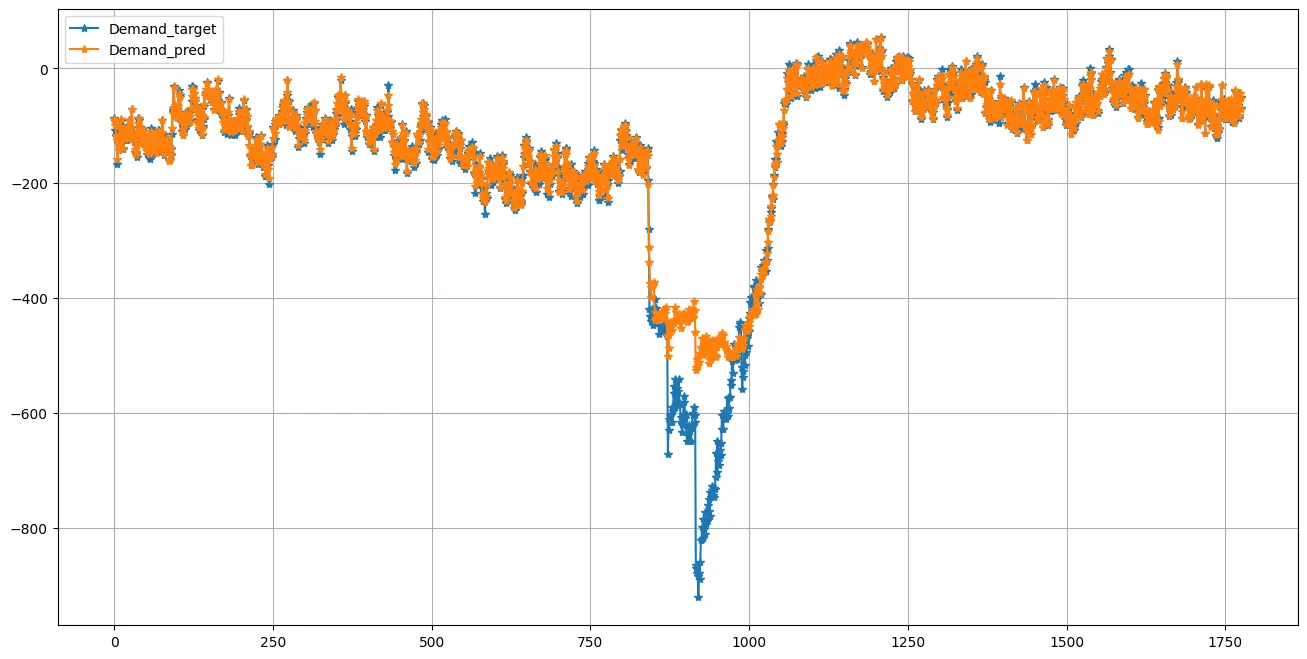
If there is a persisting anomaly, the system accumulates errors in a way we didn’t see on the calibration set:

Conclusion
Unfortunately, we could not develop an end-to-end anomaly detection system that would help TransnetBW to monitor the PICASSO system. Important data was missing. But it was still nice to see that our general approach worked just fine. We were also able to close some gaps in our understanding of the PICASSO systems. And the get-together in Wendlingen was instructive and fun. Maybe we will have a chance to work together with them in the future.